Logs & metrics
Per-invocation logs, request ids, latency percentiles, the tester.
Every invocation leaves a line
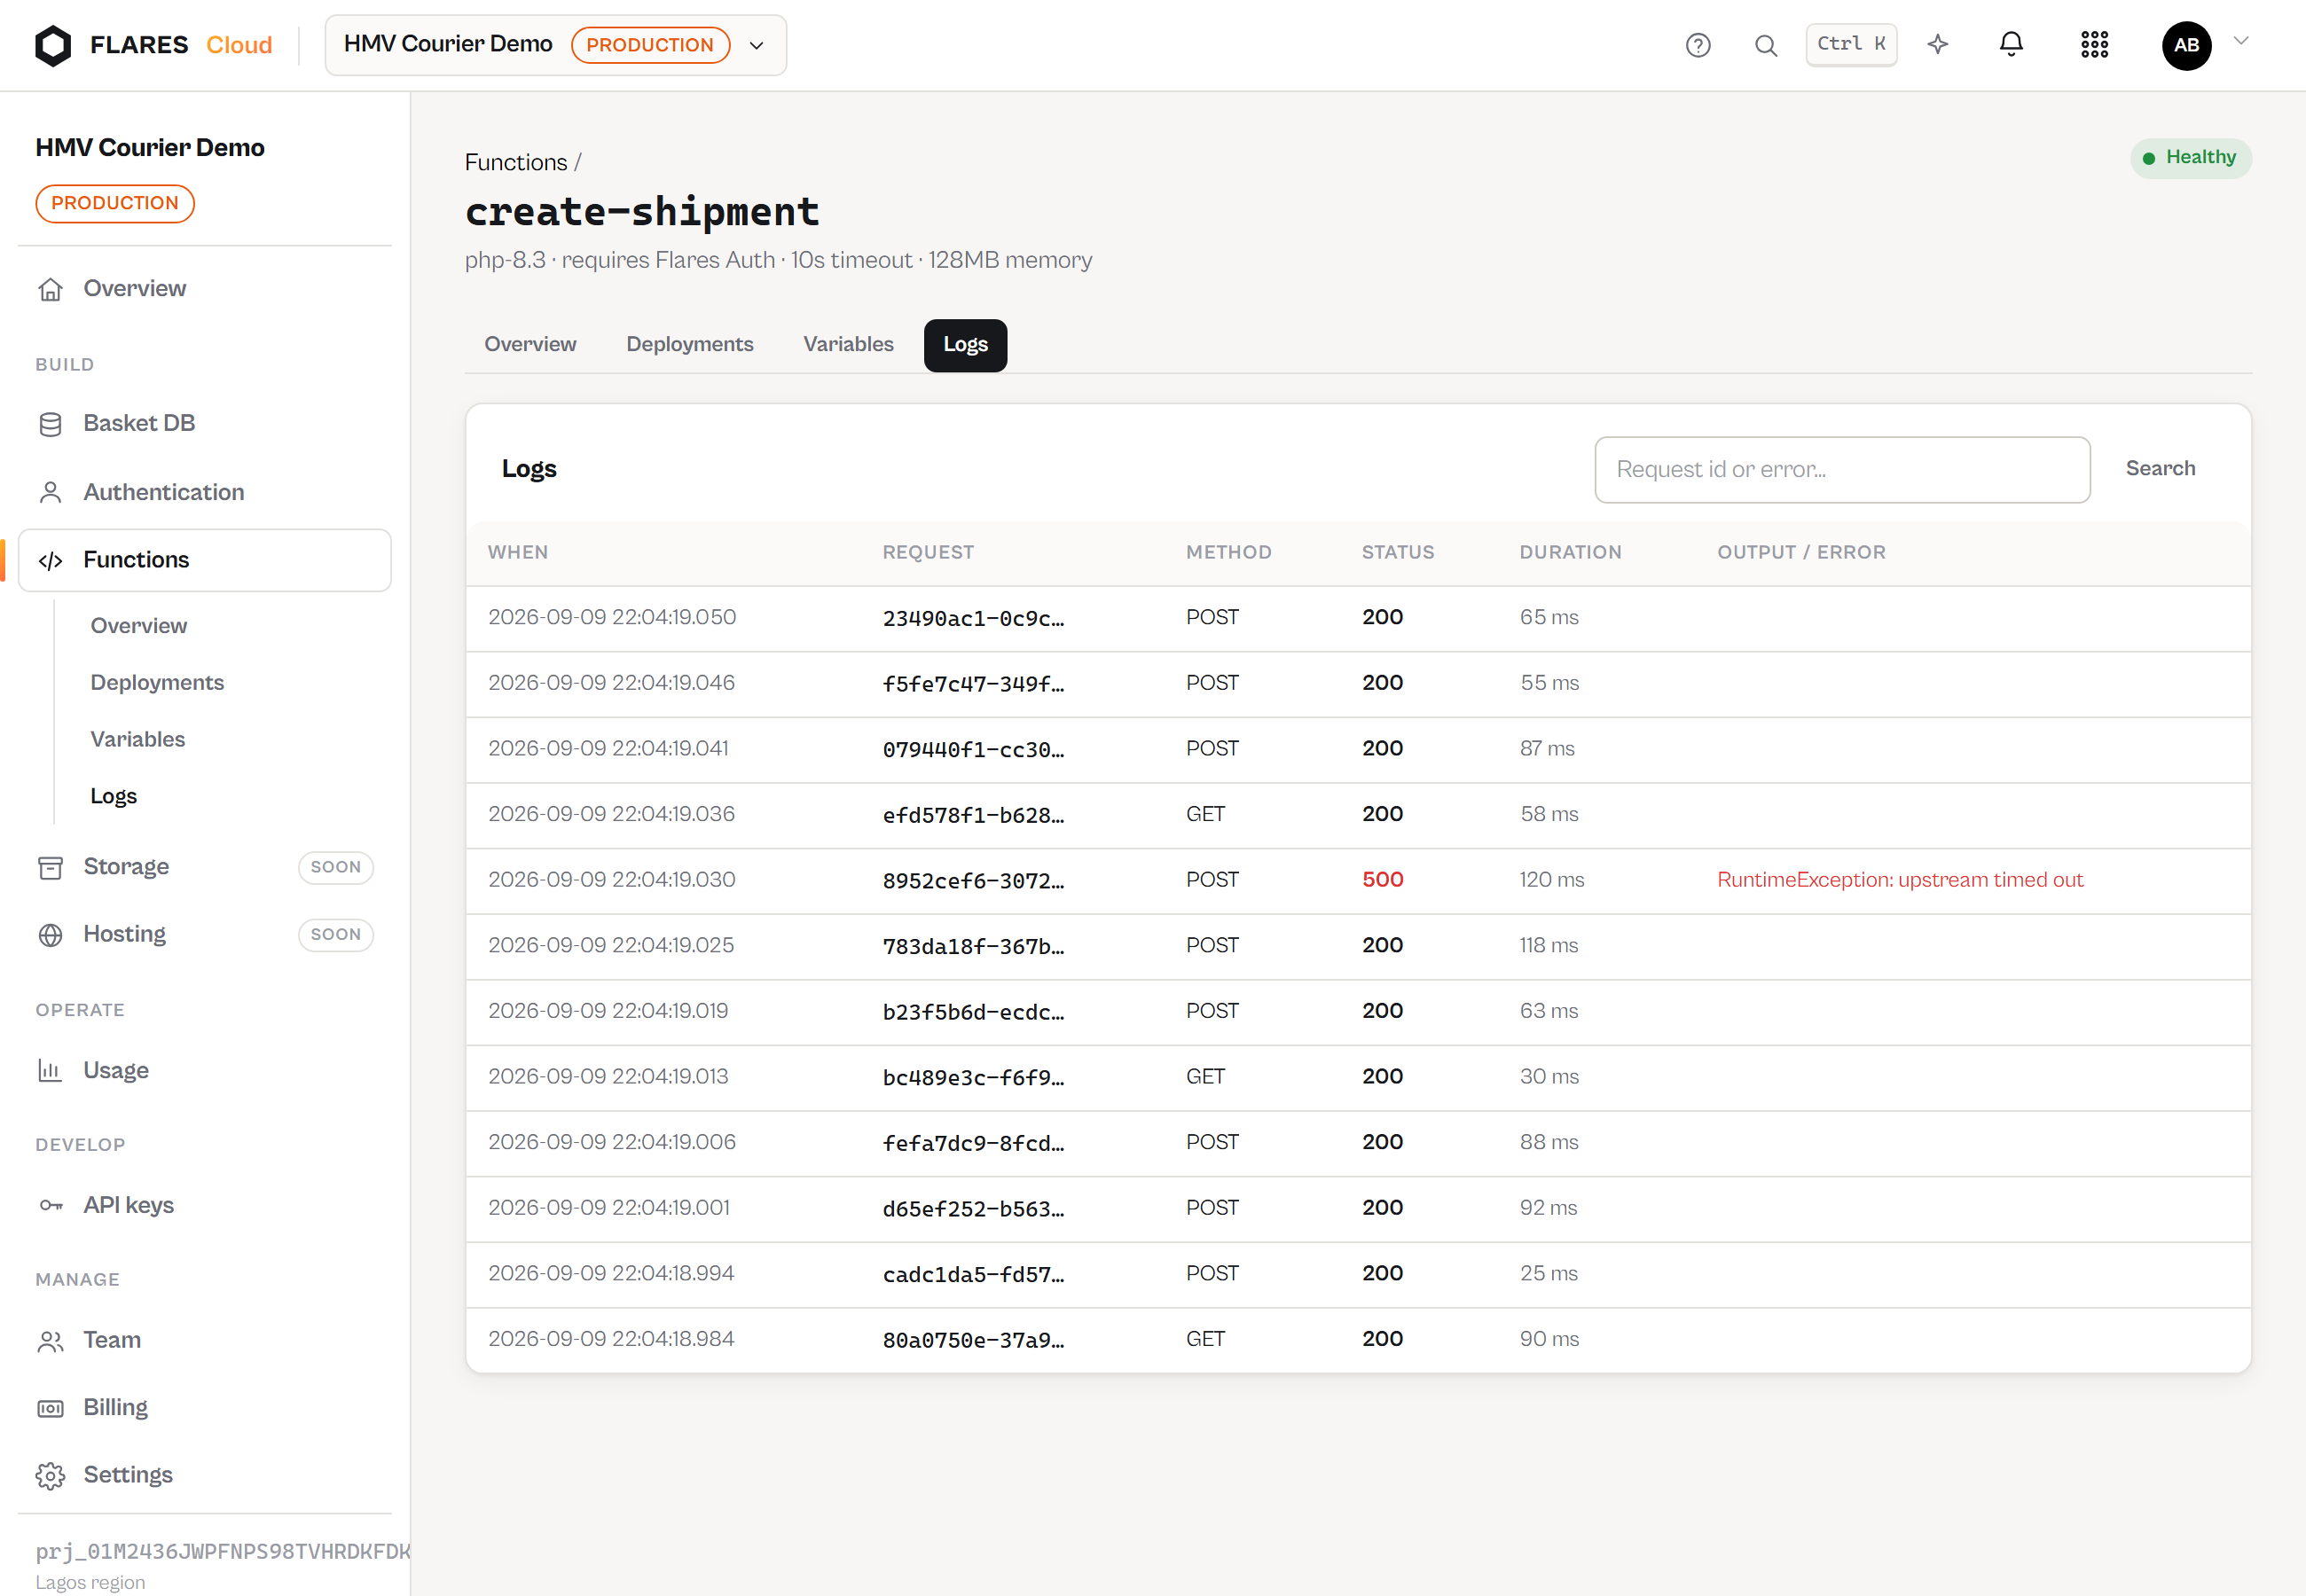
Functions → Logs lists invocations newest first: timestamp, request id, method, status, duration, and anything your code printed. Search takes a full request id or an error fragment.
Printing from your code
return function (Request $request): Response {
    error_log('validating shipment');     // → the log line
    echo "processed\n";                  // → also the log line, NOT the body

    return Response::json(['ok' => true]);
};
Output is captured, never mixed into the response. It is truncated at 16KB per invocation.
Metrics
The Overview screen reports, over the last 7 days:
- Requests and errors — counted from invocations.
- p50 / p95 / p99 latency — computed from real duration samples, not estimated.
Duration and memory are operational measurements. They tell you where to optimise; they never appear on your invoice. Functions billing →
The built-in tester
Overview has a tester: pick a method, add headers and a body, press Run, and see the status, response, duration and request id. It runs the real path — sandbox, logs and meter — so a test invocation is a billable request like any other. The form says so; there is no hidden free lane and no hidden charge.